| Home | All Classes | Main Classes | Annotated | Grouped Classes | Functions |
The chart program allows users to create, save, load and visualise simple data sets. Each data element that the user enters can be given a color and pattern for the pie segment or bar, some label text and the text's position and color. The Element class is used to represent data elements.
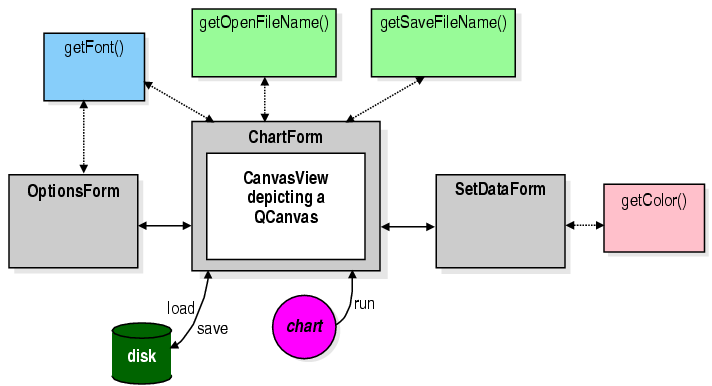
The program consists of a simple main.cpp that loads the chart form. The chart form has a menubar and toolbar which provide access to the program's functionality. The program provides two dialogs, one to set options, and the other to create and edit a data set. Both dialogs are launched from chart form menu options or toolbar buttons.
The chart form's main widget is a TQCanvasView which displays the TQCanvas on which we draw the pie chart or bar graph. We subclass TQCanvasView to obtain some specialised behaviour. Similarly we subclass the TQCanvasText class (used to place text items on a canvas) since we require slightly more than the standard class provides.
The project file, chart.pro, is used to create the Makefile that is used to build the application.
« Introduction | Contents | Data Elements »
| Copyright © 2007 Trolltech | Trademarks | TQt 3.3.8
|